Every rider accounted for.
Every resource in place.
Lanterne Rouge transforms GPS route data into actionable race-day intelligence — so you can deploy aid stations, volunteers, and emergency personnel with confidence, not guesswork.
Mapping
Routes
Modeling
of Hours
Interface
Support
The Origin
Built from 20 years of race-day reality
For over two decades, Bike Monkey has produced some of cycling's most beloved events. And for every one of those years, the planning looked the same: spreadsheets, best guesses, and crossed fingers.
When will the fastest riders hit the first aid station? When can we release our Highway Patrol? When should we implement a time cut, and how many people will be affected by it? Will the fastest riders on the short course get in the way of the elite peloton when they come back together?
These aren't mysteries. They're math. But until now, there was no tool that could take the basic inputs — routes, infrastructure points, start times, rider speeds — and produce answers in a format you could actually use.
So we built one. And now it's available to everyone.
"If only there were a tool that could let us plug in some variables and just do the work for us..."
Painful, manual procedures for estimating food, water, supply, timing, and procedural needs that are governed by how routes coincide, how they intersect, how many riders there are, and when they start. It was so easy to make a mistake. Now, with Lanterne Rouge, we can finally just provide the variables, and it gives us the answers.
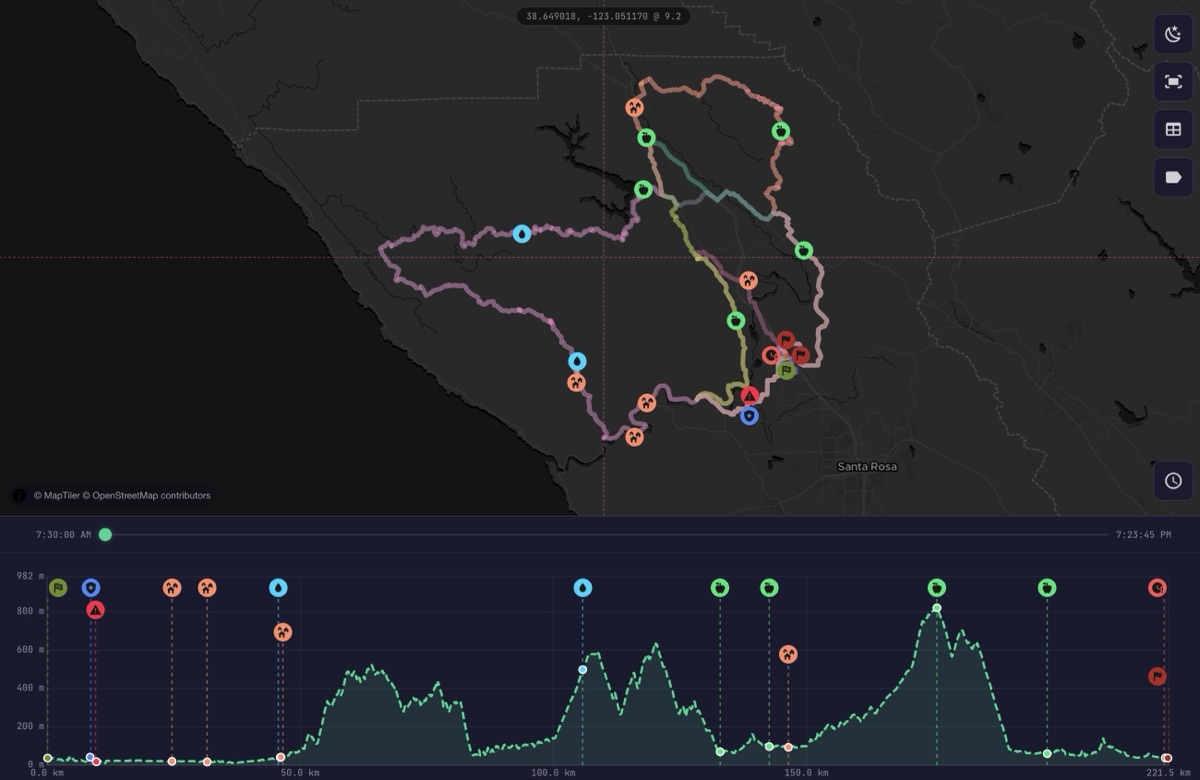
See every route. Predict every interaction.
Import multiple routes and rider profiles. Visualize how courses interact, and precisely when riders at varying fitness levels will reach any point on your course.
- Synchronized map, elevation chart, and data console
- Multiple simultaneous route and activity analysis
- Scrub by time-of-day or distance along the course
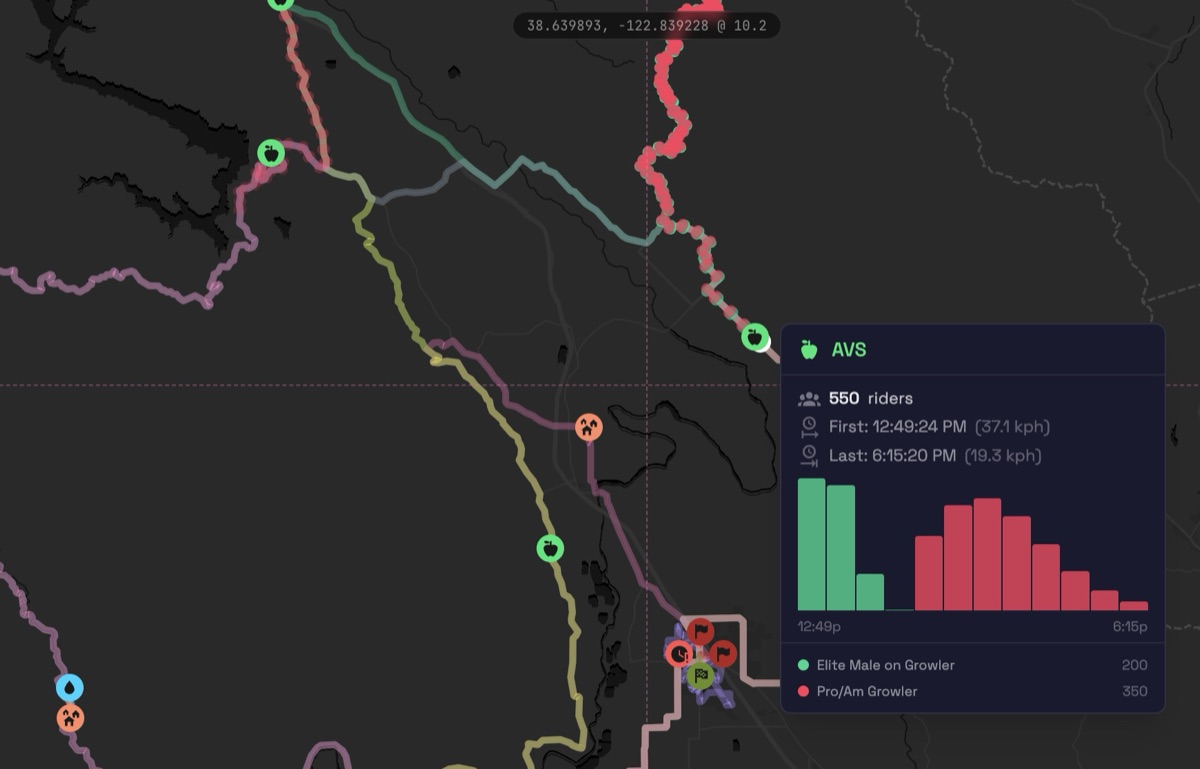
Every aid station, highway patrol, every town — fully informed.
Place intelligent waypoints on your map — aid stations, police, towns, time-cuts, and more. Each POI automatically calculates rider volume, arrival windows, and resource needs from your virtual race field.
- Competitor histograms show how people arrive over time
- Unique, reportable attributes for police, EMS, aid stations, and more
- Time-cuts divert riders to alternate routes after deadlines
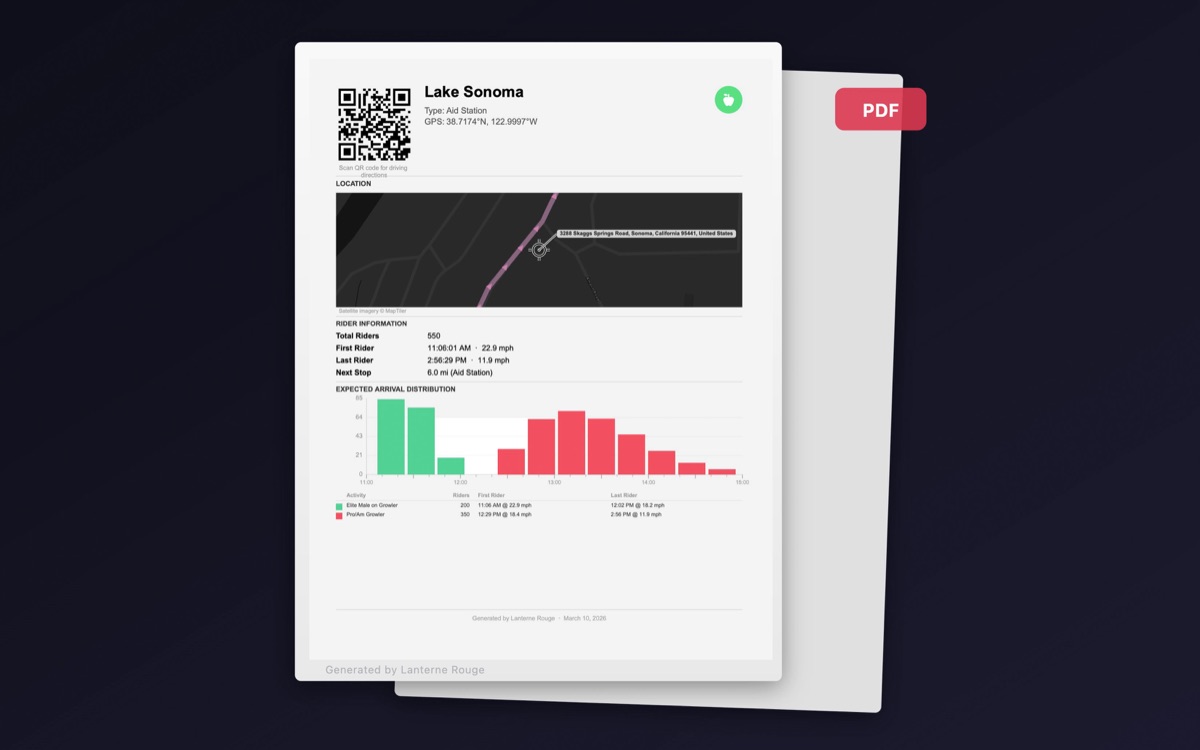
Put actionable data in every people's hands.
Generate detailed PDF sheets for each point of interest — complete with maps, QR codes for driving directions, competitor volume histograms, and arrival time windows. Print and distribute so your on-course teams know exactly what to expect.
- One-sheet PDFs with critical location information and QR code directions
- Colored arrival histograms broken down by route and competitor group
- Summary tables for at-a-glance overview of all course POI types
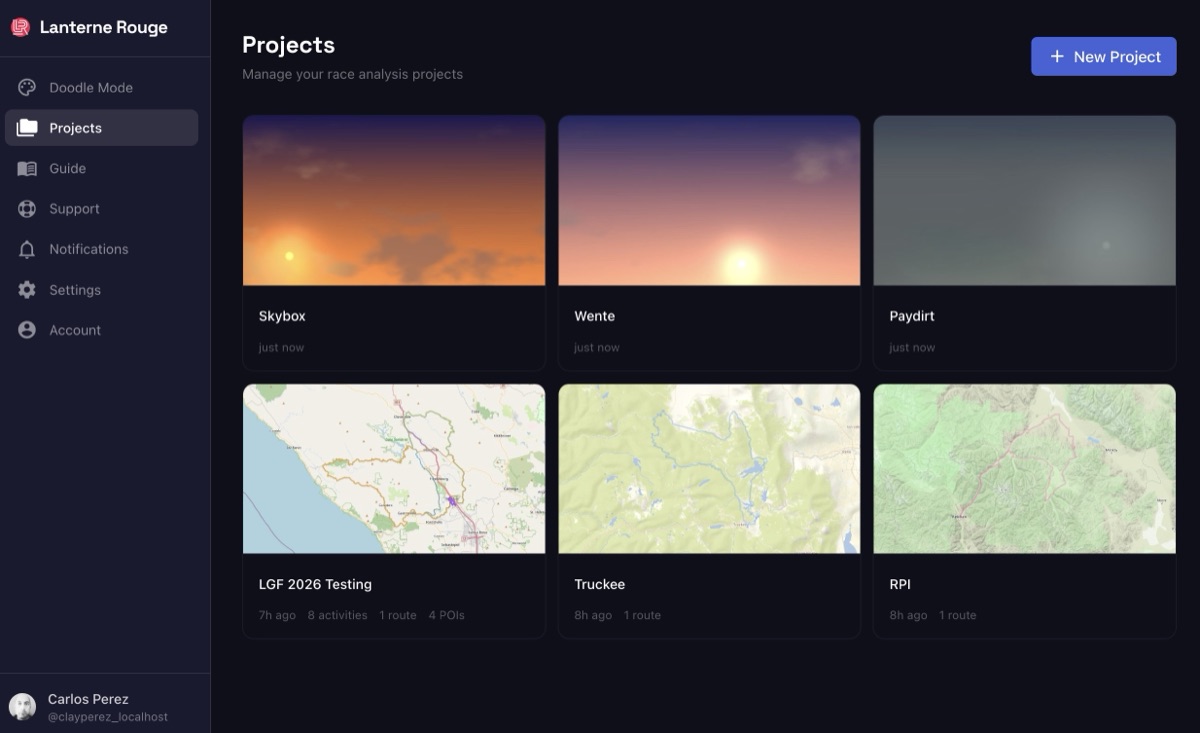
Plan together. Build confidence as a team.
Save projects to the cloud, invite your crew, and plan together with role-based access control. Project locking prevents conflicts when multiple planners are working. Export local files for offline access or sync to the cloud for anytime collaboration.
- Multi-user organizations with owner, editor, and viewer
- Automatic edit locking so nobody's work gets overwritten
- Store and manage multiple independent projects
Capabilities
Everything you need to plan with confidence
Virtual Athlete Profiles
Model rider speeds over varying grades — from elite racers to weekend warriors
Rider Volume Histograms
See exactly when and how many riders will arrive at every point on your course
Time-Cut Rerouting
Divert riders after cutoff deadlines, automatically updating downstream projections
Peloton Visualization
Watch your race field spread out in real time using log-normal distribution models
Imperial & Metric
Switch between measurement systems with a single click — your data, your preference
Multiple Map Layers
Satellite, terrain, street, and dark mode views for every planning context
Local & Cloud Save
Work offline with local project files or sync to the cloud for access anywhere
Project Safety Locks
Automatic edit locking prevents team members from overwriting each other
Elevation Profiles
Interactive elevation charts synced with your map for complete course analysis
Timeline Scrubbing
Scrub through time of day or distance to see exactly where every rider is
Distance & Time Modes
Analyze your course by geographic position or chronological time-of-day
PDF Report Generation
Generate printable, distributable reports for every point of interest on your course
Ready to shine a light on your next event?
Stop guessing. Start knowing. Join event organizers who plan with precision.